How to trade with the trend. Detailed guide for beginners
How to track fluctuations correctly and create an effective income strategy

13.09.2022
9218
9 min
3
Last updated on Aug 4, 2024
Technical analysis in trading cryptocurrencies is a way to predict the movement of their prices. The method is based on the analysis of a coin's chart and is often used on crypto exchanges.
It is believed that price movements are subject to certain patterns typical of each cryptocurrency or the market as a whole. In simple words, the study of a coin's price movement based on its historical data makes it possible to predict its rate in the short term.
What is a trend?
There are many tools of technical analysis: support and resistance levels, candlestick patterns, graphical models, indicators and trends. A trend is defined as the general direction of price movements over a certain period of time. The movements represent a series of zigzag curves, which look like waves with clearly drawn tops and troughs. Using the trend as a tool, you can not only predict the price movement, but also apply more effectively all means of technical analysis, as well as create your own trading strategies.
Types of trends
According to the direction of movement, trends are divided into uptrends, downtrends and sideways (flat). In the cryptocurrency market, it is believed that the flat accounts for 70% of market movements, and the remaining 30% are taken by the uptrend and downtrend.
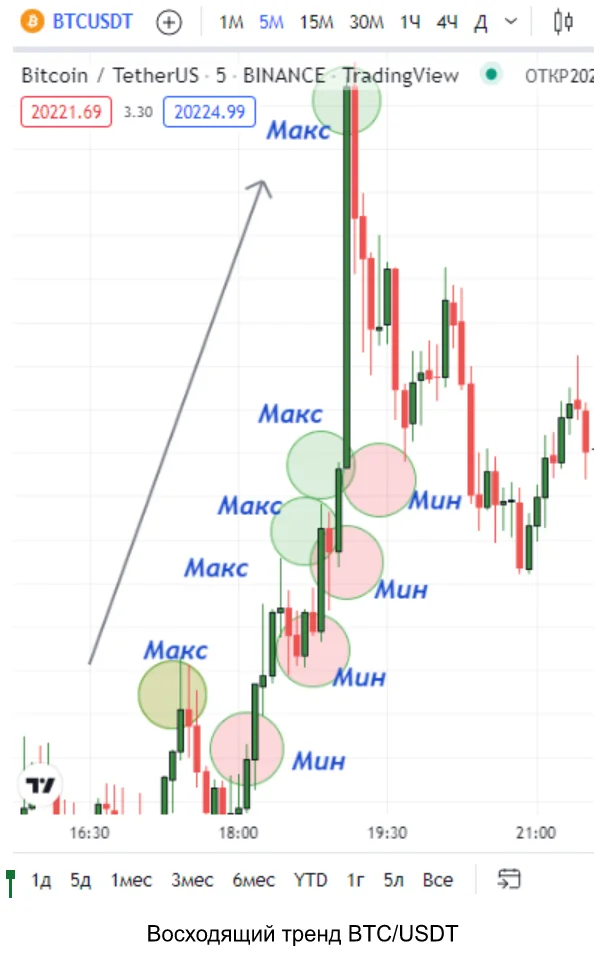
Uptrend
An uptrend is a series of increasing price lows and highs. Each successive low is higher than the previous one, and each successive high is also higher than the previous one. During an up-trend, the market is dominated by the power of buyers (bulls), who are pulling the price up.
The 5-minute chart of BTC/USDT shows an up-trend section. Conditions for the location of lows and highs are fulfilled. The price moves in a zigzag pattern, showing growth and decline. The general trend is upward.
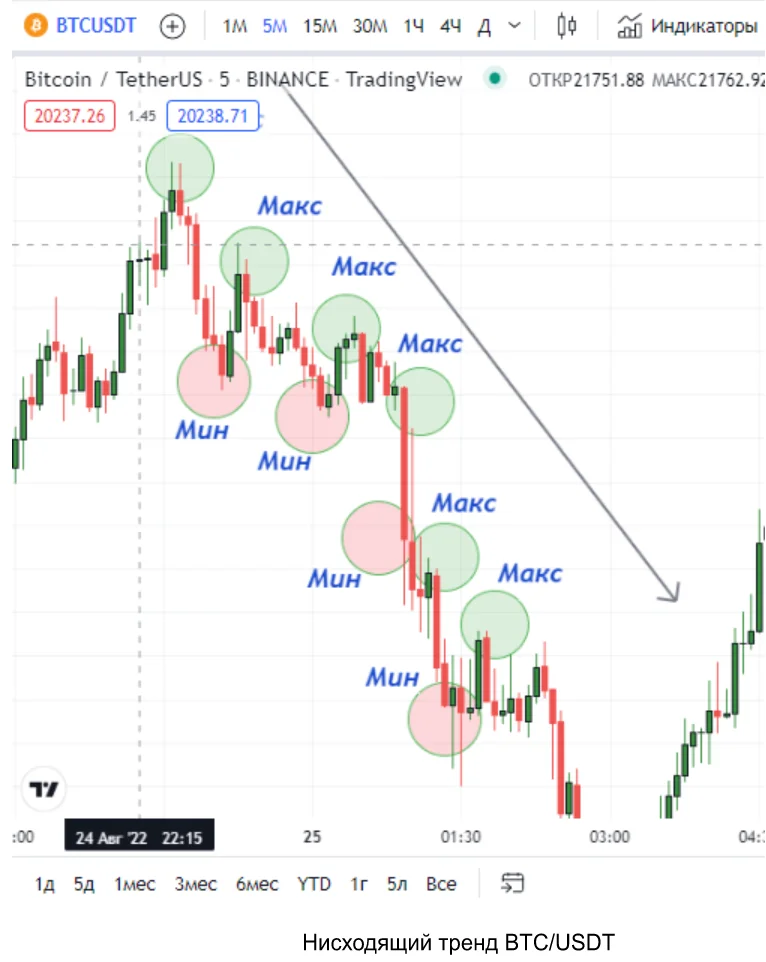
Downtrend
A downtrend is a series of declining price highs and lows. Each successive high is lower than the previous high and each successive low is also lower than the previous low. The market is dominated by the sellers (bears). At this point, the price decreases. An example of a downtrend is shown on the BTC/USDT chart.
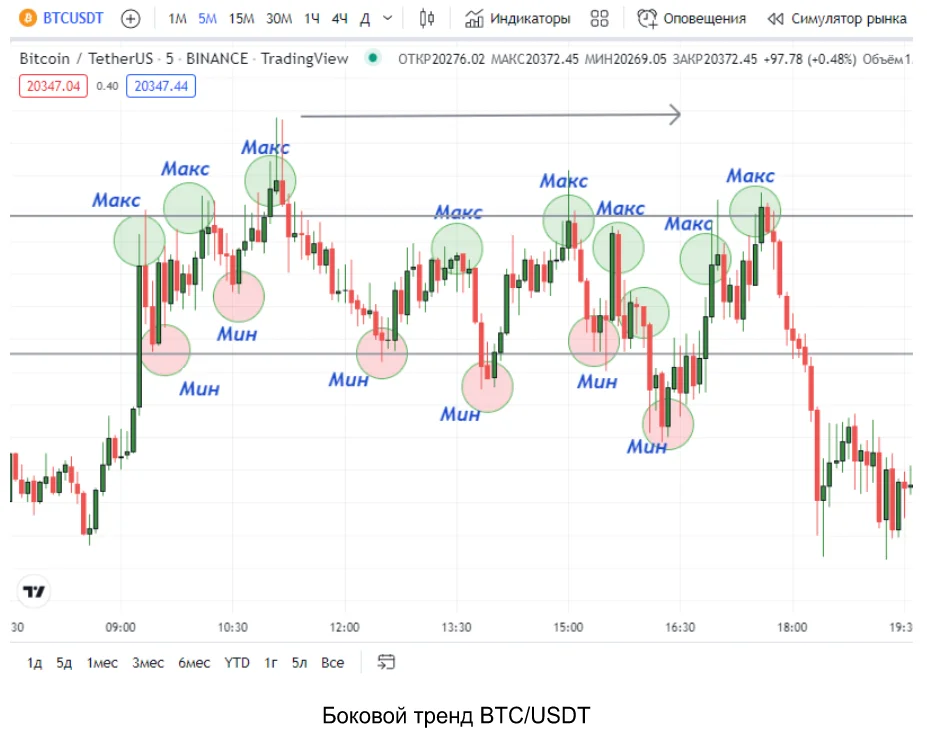
Sideways trend
A sideways trend is usually called a flat or consolidation. It is a horizontal price movement in a certain range without a clear trend. The price moves in a zigzag manner. The price lows and highs are practically on the same level. The strengths of bears and bulls are equal, which indicates an equal amount of selling and buying.
During a consolidation period bears or bulls gain strength to push the price up or down depending on market conditions.
The 5-minute chart of BTC USDT shows an example of sideways, where the movement of the crypto asset is carried out in a sideways corridor.
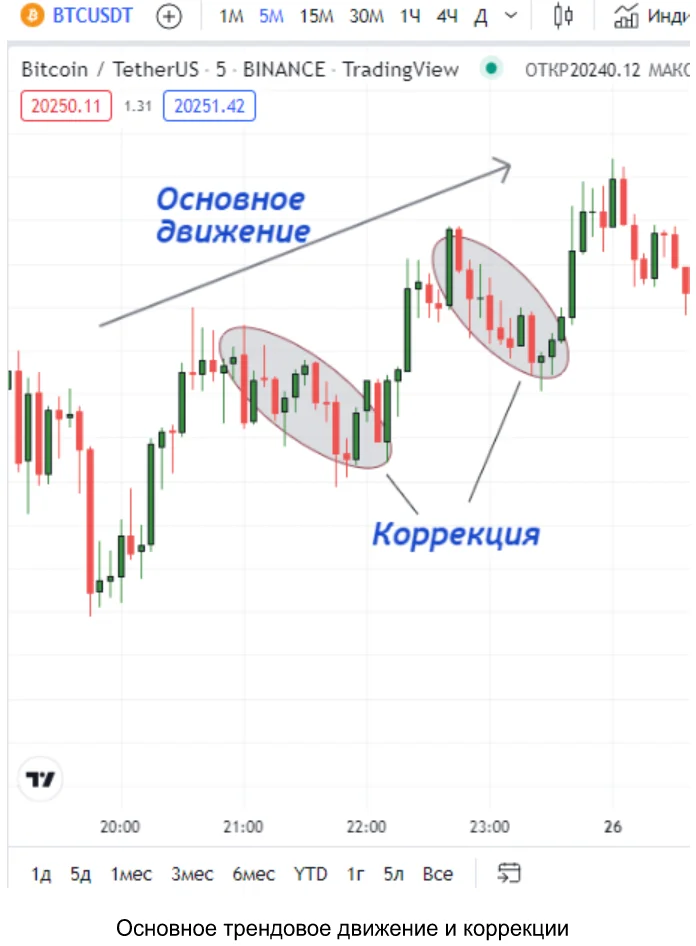
It should be noted that in upward and downward trends of cryptocurrencies, there is a main and a corrective movement (pullback). A correction is a temporary price movement against the main trend. Once the correction is complete, the price of the cryptocurrency continues to move in the main direction.
There are two types of corrections:
- Uptrend. The main trend is downtrending and the price temporarily increases;
- Downtrend. The main trend is uptrending and the price temporarily decreases.
The pullback occurs due to several reasons. The main one is that the crypto asset is overbought or oversold. In other words, a significant portion of traders think it's time to lock in profits and close buy or sell trades, and the trend reacts by correcting.
The figure shows an example of a downward correction. In a bitcoin uptrend, the correction moves downward.
Division by time
In addition to direction, trends are divided by the duration of existence:
- Short-term. Duration from a few hours to a month. Dependence on a variety of random events (e.g., news background);
- Medium-term. Duration from a month to six months. As a rule, these are correction trends;
- Long-term. Long-term trends last more than one year. They are characterized by the fact that large participants of the cryptocurrency market (market makers) trade here.
Drawing the trend line
To determine the direction of the trend, a trend line is used as a tool. In addition to the direction of the main movement, this straight line helps to determine the strength of the trend. The greater the slope, the stronger the trend. Using the trend line, you can predict the possible change in trend movement, as well as the moment when it will happen.
Drawing a trend line requires following certain rules:
- For an uptrend, the straight line is drawn through at least two of the most significant lows and serves as an inclined support line. The lowest low is chosen as the starting point on the chart section. The further point will be the next low. From the drawn trend line, it is optimal to buy or record sales.
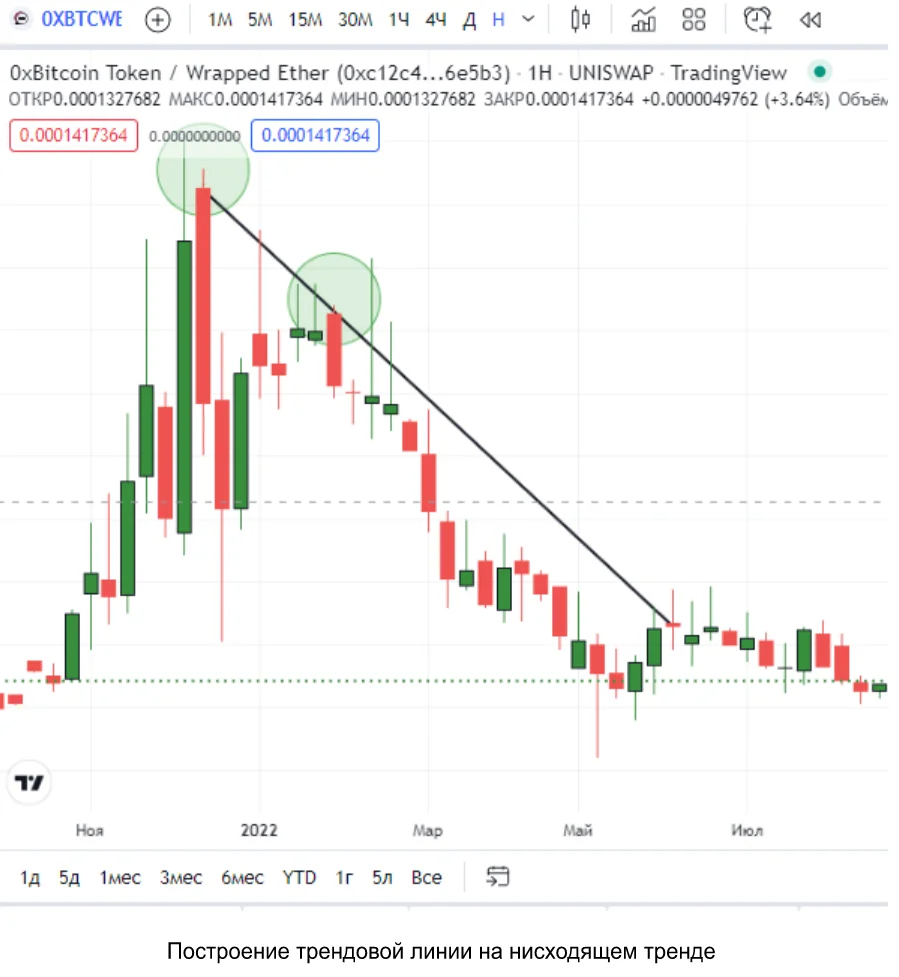
- For a downtrend, the straight line should connect at least the two most significant highs. It acts as a sloping resistance line. The anchor point on the analyzed section of the chart will be the highest high, and the second point will be the next high. From the constructed trend line, it is optimal to make transactions to sell or to fix purchases.
Over time the price will break through the inclined support or resistance level. Then the trend line should be rebuilt according to the new low (or high) in accordance with the direction of the trend.
There are two methods of drawing trend lines: by candle bodies or by their shadows. Both methods are correct, but it is important to stick to the chosen one.
The basics of trend trading
It is necessary to adhere to the rule: trade only with the trend and not against it. To trade with the trend, it is necessary to do the following:
- Determine the moment to enter the market;
- Determine the possible risks (setting a stop loss order);
- Income generation (profit taking by partial closing of trading positions).
Trend line trading strategies
One way to trade is to open a long position after a rebound from the trend line.
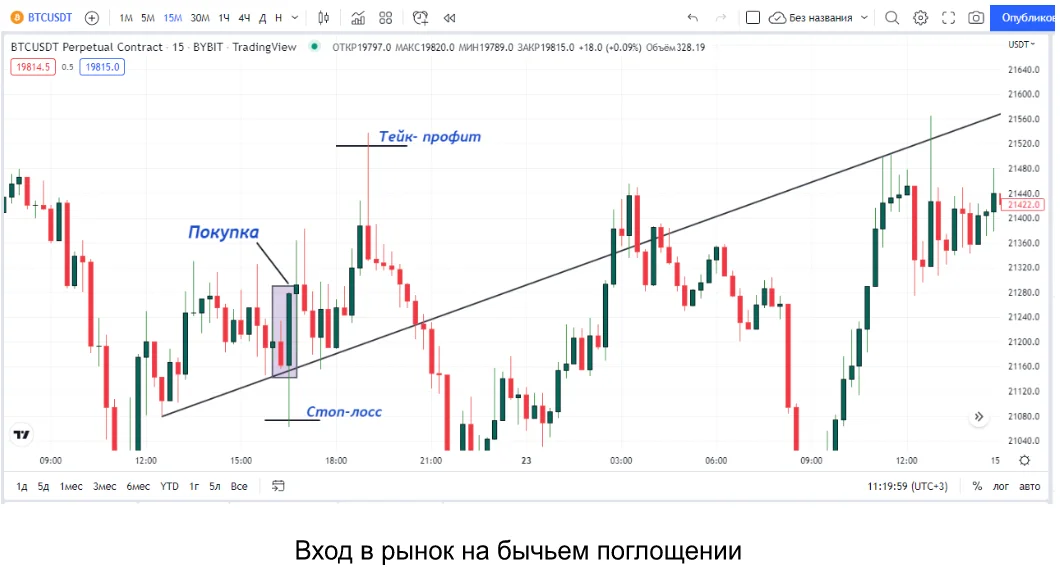
First, on the BTC/USDT chart, you should determine the direction of the trend. It can be seen that the trend line shows an upward direction.
Favorable moment to open a long position is the so-called “bullish engulfing” and the price rebound from the sloping support. A bullish engulfing is a classic Japanese candlestick pattern. It means that on the downward movement, just before the reversal of the price, the body of the last bearish candle is completely overlapped by the body of the subsequent bullish candle. An insurance stop-loss is set just below the previous touch of the trend line (approximately on the shadow of the entry candle).

Another strategy involves opening a long position on a breakdown of the trend line of the downtrend.
First, the trend line of the BTC/USDT downtrend is constructed using the price highs. After the breakdown, it is necessary to wait for the formation of the first bullish candle and open a long position. It is advisable to place a stop loss just below the previous low. In practice, each trader determines the goals (profit) for him/herself. In this case, the take profit is set at the level of the beginning of the downtrend.
Stop Loss and Take Profit are pending orders to limit risk, which are triggered automatically. They are indispensable for adhering to the principles of optimal money management in trading. Stop-loss closes the trading position, limiting possible losses if the market moves in an unfavorable direction for the trader. Take Profit marks the specified amount of profit.
When opening deals, it will also be useful to be guided by the trading volume. The increase of trading volume serves as an additional signal to open a position. Falling volume during price growth indicates the possibility of a false breakout or decline in price lows.
Timeframes indicate the fractal nature of the cryptocurrency market. In other words, those patterns that are observed in long-term trends can also occur in short-term time frames. However, more reliable signals for opening trades are generated on higher time frames.
Advantages and disadvantages of trading with the trend
Advantages:
- High percentage of profitable trades (especially on highly volatile cryptocurrency markets), optimal ratio of risk to profit;
- Opening trades on the breakdown of the trend line and on the rebound from it brings great profits (especially scalping strategies);
- Strategies are applicable to any cryptocurrency on all time frames;
- It is easy to enter and exit the market.
Disadvantages:
- High volatility of crypto assets increases not only profitability but also risks, especially in case of margin trading;
- There is little information about important support and resistance levels due to the “young” nature of the cryptocurrency market. Even BTC has short history in comparison to stock market and Forex assets, where the formation of key levels took decades;
- Many novice traders miss a trend change due to lack of proper practice. The losses in this case increase.
Basic risk management
Risk management is one of the key skills of a trader. It largely determines the stability of profits received and the size of possible losses on volatile unpredictable fluctuations of crypto assets. Basic risk management depends on the following factors:
- Transaction risk limitation. The difference between the entry price of the trading position and the size of the stop loss determines the risk of possible losses. Practicing traders recommend that the risk of one transaction should not exceed 1,5%-2% of the total deposit size;
- Limitation of total possible loss of traders. The total risk of open trading positions must not exceed 20% of all funds on the deposit. In other words, if all trades are closed with a loss, at least 75%-80% of the original capital should remain on the user's trading account;
- Trade profitability. The recommended ratio between risk and profit should be approximately 3:1. The amount of profit is determined by the difference between the opening price of the trade and the take profit level.
It is generally accepted to divide three types of risk management when trading cryptocurrencies: conservative, moderate and aggressive. Accordingly, the trade risk for each type will be 0,6-1,5%, 2-3%, and 5-7%.
Example of trade calculation with trend trading
Let's look at a practical example of calculating the trade amount for a conservative trading strategy, which is traditionally recommended for beginners.
The capital risk is 10-15%. Initial capital is $2000.
The plan is to buy the LTC cryptocurrency at the current price of $100. Recommended stop loss is set at $95. At a risk of loss of 1,5% of the total capital of $2000, the amount will be $30. Possible loss is $100 - $95 = $5.
Allowed volume and amount of trade, including risk, is 30/5=6 LTC ($600).
However, this amount equals 30% of the total size of the deposit, which is unacceptable for a conservative strategy. The maximum of 15% is recommended, which is $300.
The risk for each coin is $5. Thus, at a ratio of 3:1, the amount of income per coin is $15. So, the profit will be recorded at the level of $115.
Conclusion
The trend and its lines are some of the simplest and most basic tools of technical analysis. They are easy to learn and are a good help when analyzing any cryptocurrency asset.
Trend trading strategies provide an opportunity to make money in both bear and bull markets.
Useful material?
 Telegram
  Twitter
 Basics
Why Satoshi Nakamoto’s technical manifesto for a decentralized money system matters
Oct 31, 2022
Basics
Experts evaluated the development prospects of the new ecosystem and the investment attractiveness of its token
Oct 20, 2022
Basics
Review of the most profitable offers from proven trading platforms
Aug 29, 2022
Basics
The Ethereum Foundation team has published a breakdown of major misconceptions about the upcoming network upgrade
Aug 18, 2022
Basics
What benefits the exchange offers, and what else is in the near future
Aug 4, 2022
Basics
Let's take a look at the varieties of this new form of management and its earning potential
Aug 1, 2022
Cryptocurrency rates
-

Bitcoin
$63 364
BTC
+0.79%
-

Ethereum
$2 551.16
ETH
+3.56%
-

BNB Smart Chain
$579.4
BSC
+1.23%
-

Ripple
$1.08
XRP
+2.06%
-

TRON
$0.160134
TRX
-1.59%
-

Dogecoin
$0.070545
DOGE
+1.95%
-

Zcash
$483.22
ZEC
+3.86%
-

Cardano
$0.188634
ADA
+8.47%
-

Stellar XLM
$0.173852
XLM
+1.7%
-

Polkadot
$3.32
DOT
+5.27%