Top 5 popular technical analysis indicators. Guide for beginner crypto traders
How to find effective entry points and why you should not rely on one indicator only
05.07.2022
5168
8 min
1
The material is not an investment recommendation and is published for information purposes only.
Traders use different tools and their combinations to identify entry points into the cryptocurrency market. Technical analysis indicators are calculated based on historical data and various mathematical formulas. Indicators in the form of pictures are superimposed on charts and help traders to make correct trading decisions quickly. Let's look at five of the most popular tools.
Moving Average (MA)
Moving Average is a result of calculating the average value of the cryptocurrency price for a certain time period. The basic form of the indicator is a simple moving average (SMA). The indicator is presented on the chart as a line, which is the arithmetic mean of the cryptocurrency candlestick closing prices for a specific period.
For example, a moving MA 50 has a period of 50. This means that the average result of the closing prices of 50 candles is calculated and a line is drawn on it. The longer the period, the smoother the indicator looks.
There are the following types of moving averages:
- Simple Moving Average (SMA) — all closing prices are equal;
- Weighted Moving Average (WMA) — the last closing price is the most important one;
- Exponential Moving Average (EMA) — it tracks the market dynamics faster than the previous two methods.
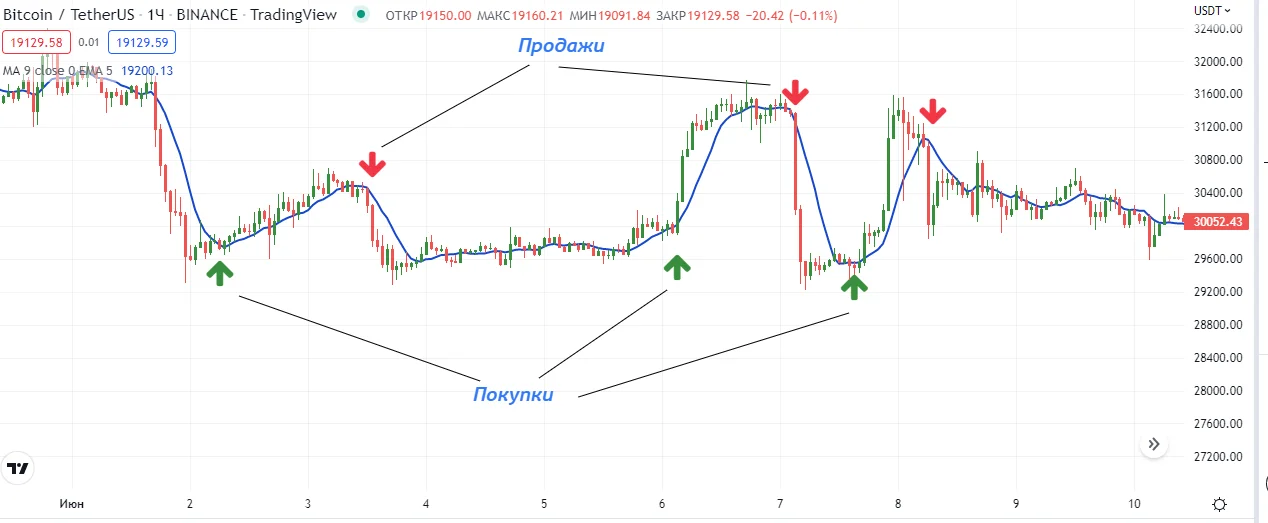
MA indicator is used to identify entry points into the market. When the trend line of a crypto asset crosses the moving average from bottom to top, it signals the opening of buy orders. When the indicator crosses the moving average from top to bottom, there is a signal to open short positions (sales).
MA crossover with a trend line
To open sell or buy positions, the method of crossover of longer- and shorter-period moving averages is used. For example, the crossover of MA 50 and MA 200. The moment of MA 50 crossing from bottom to top of MA 200 is called a golden cross and indicates a buy. Inverse crossover of moving averages is called a death cross, and it indicates a sell signal.
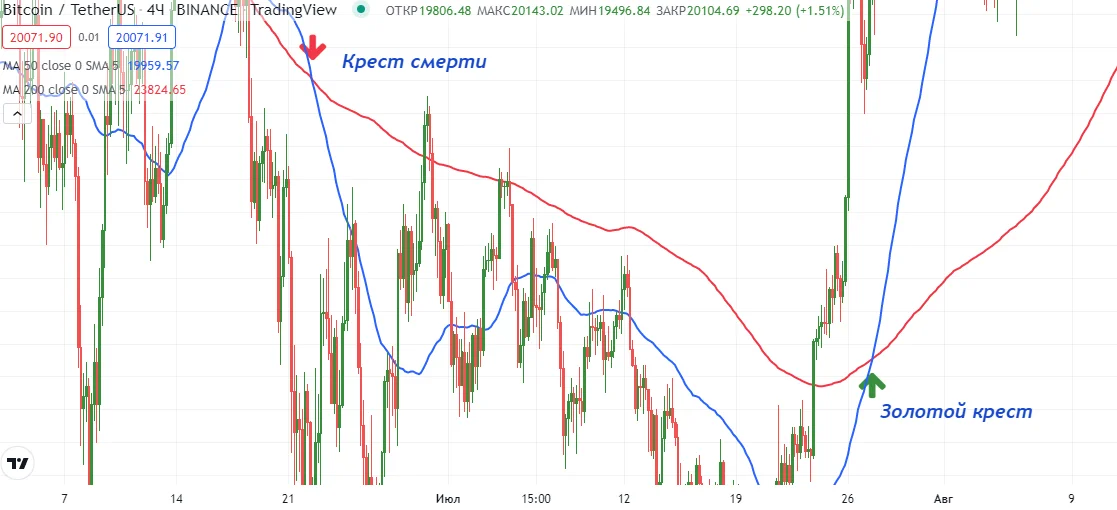
The golden cross and the death cross
Volumes indicator
Tracking trade volumes on the chart is useful to determine the reliability of the trend movement. The indicator is displayed in the basement of the chart. Volumes indicates the number of traders who are buying and selling the crypto asset at the moment. The red bars of the tool indicate a decrease in trading volume, blue bars indicate an increase. The tool is effective for use on breakouts. The price crosses the most important resistance or support level, which indicates the opening of a buy or sell order.
On the 4-hour bitcoin chart, there are obvious moments of a strong level breakout: initially as a support level and then as a resistance level. In the first case, growing volume indicates increased selling, and in the second one, increased buying.
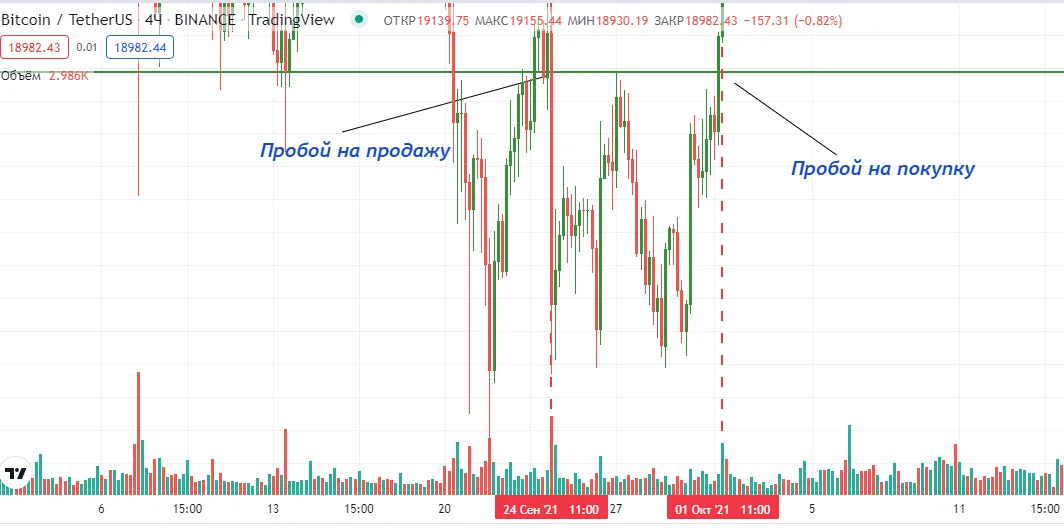
Selling and buying moments with a volume indicator
High volatility of cryptocurrencies is always associated with a high level of noise (false alarms). The average value of the volume indicator is often used for filtering. Thus they combine the MA and the Volumes.
The moments of crossing of two indicators (above the moving average) show traders the best entries into the market, depending on the color of the Volumes columns. For buying — green, for selling — red. Volumes indicator readings below the moving average should be regarded as market noise and not taken into account.
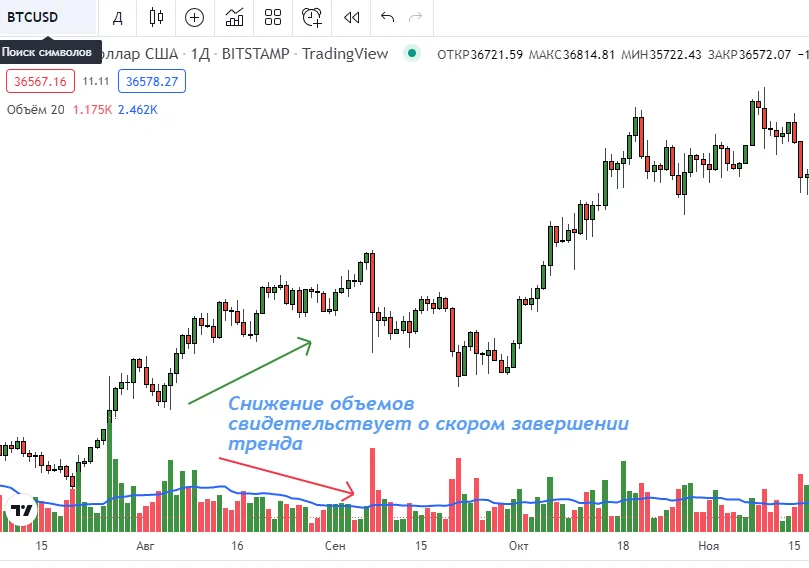
Often, cryptocurrency traders use Volumes values to determine the duration of the current trend. Decreasing columns on the chart of an uptrend movement indicate the imminent end of the trend.
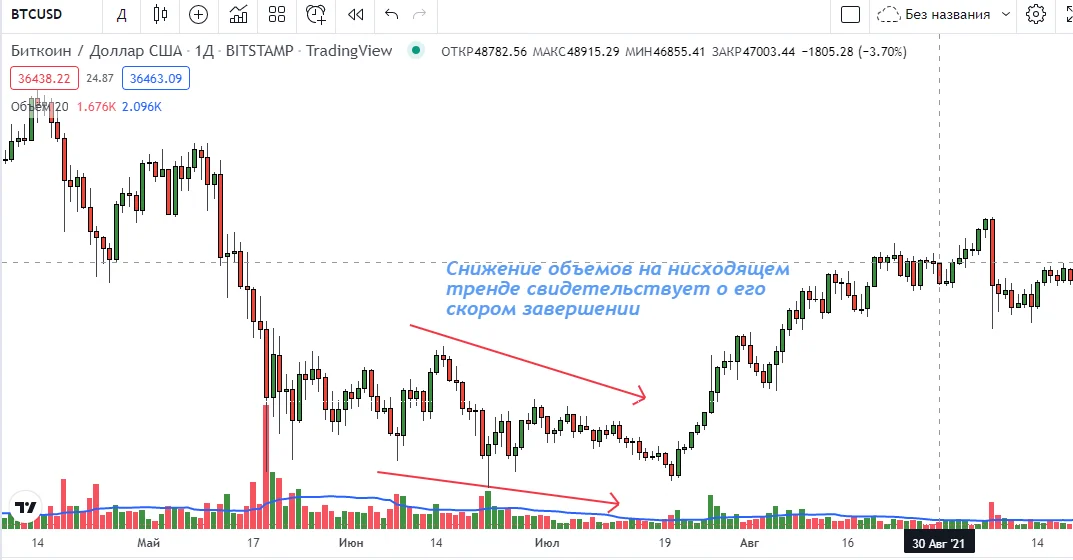
Decreasing columns on a downtrend also indicate its imminent end.
Stochastic RSI Oscillator
Stochastic oscillator (StochRSI) is designed to monitor overbought and oversold digital assets.
Overbought refers to a market condition when the price of a trading asset has gone too high. Oversold indicates an excessive price decrease.
The basic principle of the StochRSI application is to search for signals on the reversal of the price movement. A pronounced upward or downward trend is characterized by a large number of false signals. Therefore, the maximum efficiency of StochRSI application is noticed in the flat (sideways) movement of cryptocurrencies. Determining the price momentum, the indicator displays the percentage ratio of the closing price and the maximum-minimum range for the selected time period.
The StochRSI values range from 0 to 100:
- Values above 80 indicate closing prices near the upper boundary of the range;
- Values below 0 indicate closing prices near the lower boundary.
StochRSI generates a lot of signals to open long and short positions:
- Entrance into an oversold or oversold zone;
- Crossing the zero (median) line;
- Divergence of indicator values with the price value;
- The fast and slow StochRSI lines cross each other.
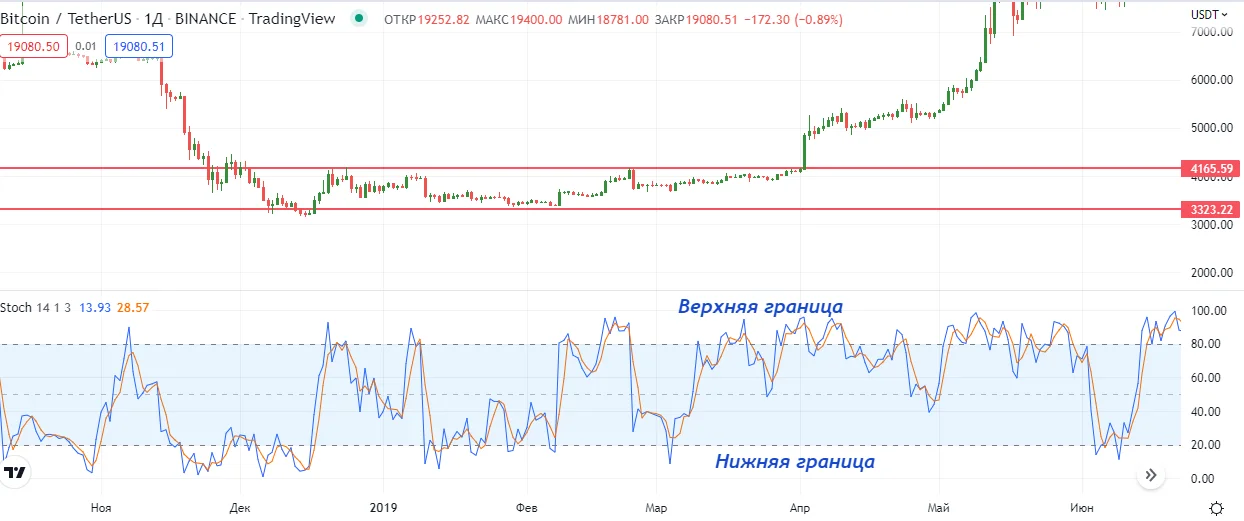
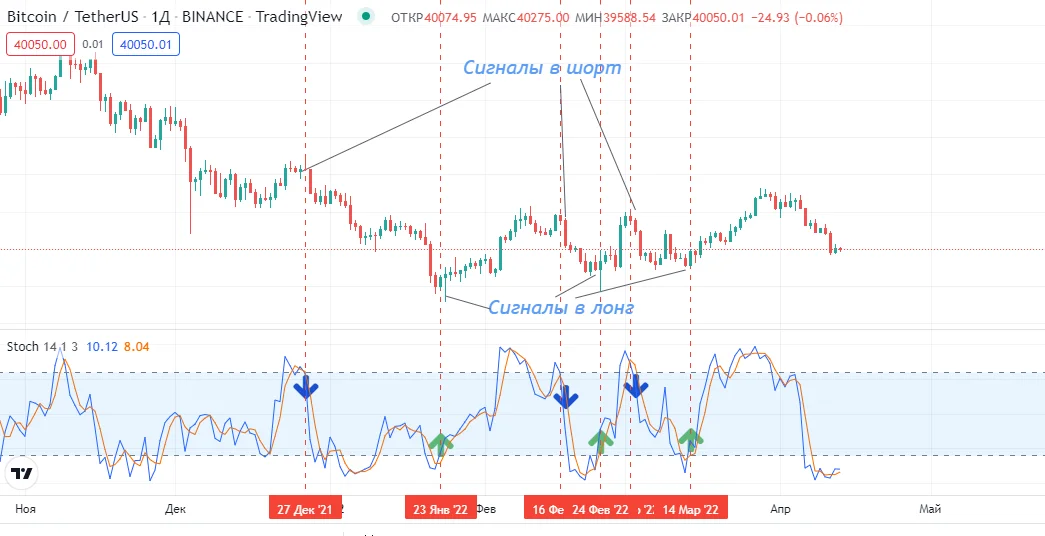
On the daily chart of BTC/USDT the price moves in a sideways range. Favourable moments of opening short positions (sell orders) are noticed when the price crosses the upper boundary of StochRSI from the bottom up. Moments to open long positions (buy orders) are determined by crossing the lower boundary of the indicator from the bottom up. The size of the candles on the chart indicates the strength of the signals. Moving in the 20-80 range the indicator clearly shows how the market becomes saturated with purchases, moves into sales, and vice versa.
Divergence shows the difference between the values of the crypto-asset chart and the indicator. In this case, the growing trend of BTC/USDT from the beginning of September to the middle of November 2021 is clearly seen. During this period, the StochRSI maximums display a decline. The divergence signal served as a precursor to a rapid change in the trend. Bitcoin price began to decline.
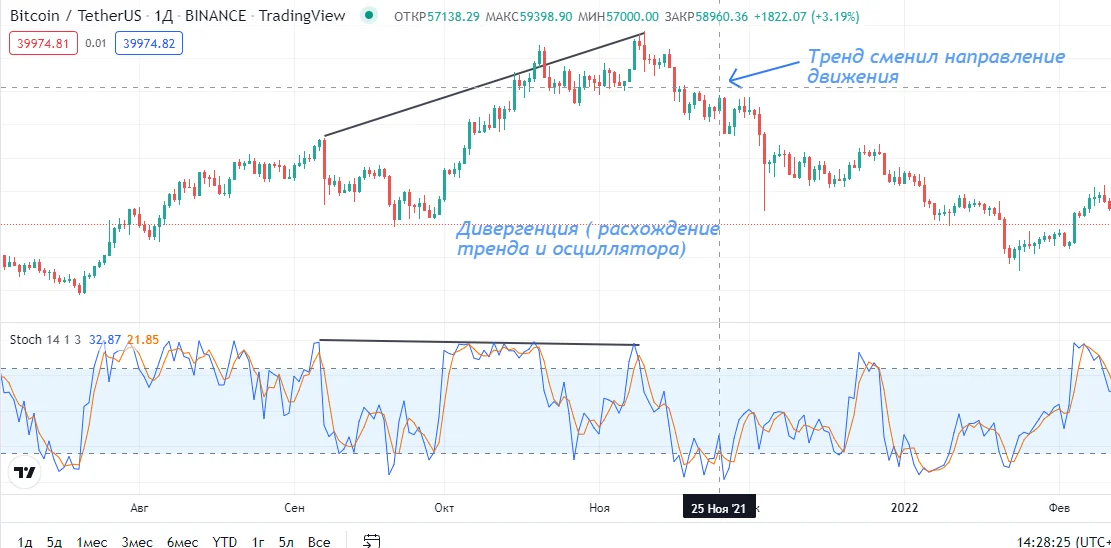
Divergence
Bollinger Bands
The Bollinger Bands indicator diagnoses the volatility of the cryptocurrency, shows the direction of price movement, as well as overbought and oversold levels.
Swing traders (short-term traders) and medium-term traders often use this tool in their practice.
Bollinger Bands consists of three simple moving averages, which analyze the situation on the market.
Characteristic features of SMAs 20:
- Upper band. Change by 2 standard deviations (STD) forward;
- Middle band. It characterizes the main trend movement;
- Lower Band. Change by 2 standard deviations (STD) backward.
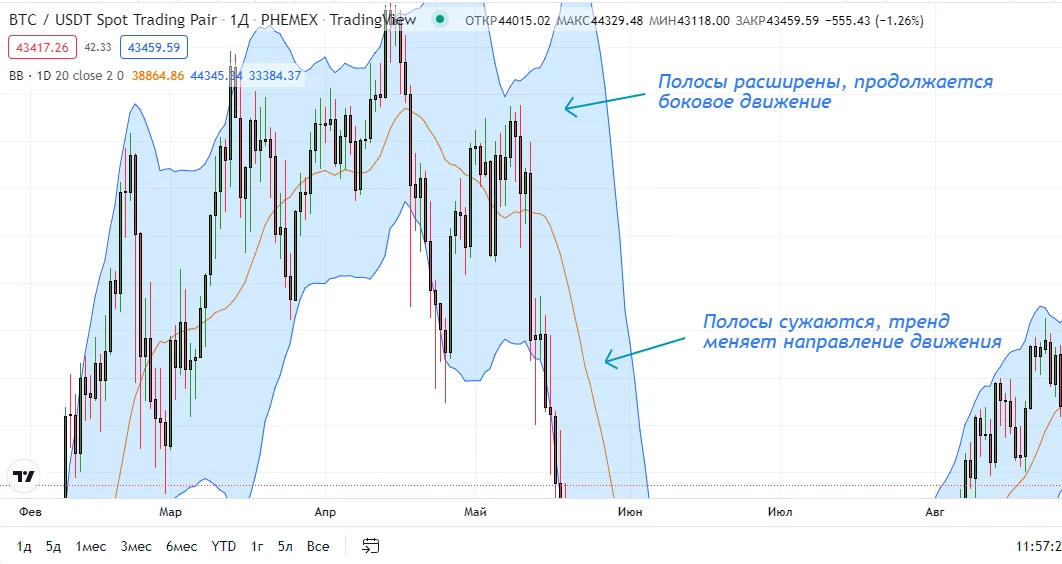
Bollinger Bands width is regulated automatically. Unstable market conditions (important news release, market makers activity) make bands widen. Narrowing of the bands reflects stabilization of the market situation. Thus, the Bollinger line indicator, as an oscillator, assesses the state of any cryptocurrency asset — whether it is overbought or oversold.
The standard parameters — period 20, deviation 2 — allow to observe 95% of the traded cryptocurrency movements on the chart. However, traders with experience change the settings to suit themselves. But it should be taken into account that an excessively high period reduces the sensitivity of Bollinger Bands, increasing the delay. The indicator provides quality signals in combination with other technical analysis tools.
Divergence of bands indicates that the market situation remains the same. With a narrowing, a price reversal is possible. In this case, the trend loses strength.
With a high probability, the price, starting from the lower boundary, should reach the upper one or vice versa.

The movement of the asset price above the middle line determines an uptrend. When the price is below the middle line, the trend is downtrending.
By applying the above signals, traders are more successful in opening buy and sell deals.
Ichimoku cloud (Ichimoku Kinko Hyo)
Ichimoku Kinko Hyo indicator predicts the strength of the trend, its direction and identifies support and resistance levels.
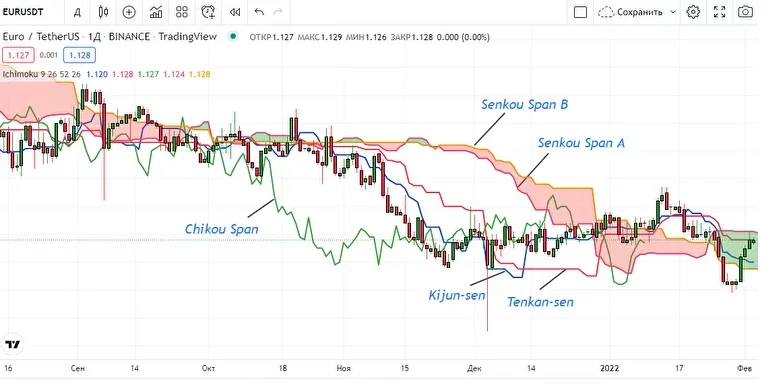
The tool contains five moving averages:
- Kijun-sen is the base line in red. Moving average with a period of 26;
- Tenkan-sen is the reversal line in blue. MA 9;
- Senkou Span A is the purple line. The average of the values between Kijun-sen and Tenkan-sen is displayed on the chart with 26 periods ahead;
- Senkou Span B is the result of calculations of averaging extremums (maximums and minimums) for the period 52. Orange moving average is shown 26 periods ahead of schedule;
- Chikou Span is the green line with 26 periods behind.
The area marked Senkou Span A and Senkou Span B is a cloud. When Senkou Span B is located below Senkou Span A, the cloud becomes green. Otherwise, the cloud is colored red. The purple and orange lines, indicators ahead, predict the next 26 periods. The green curve lags by the same amount of time, displaying previously reported data.
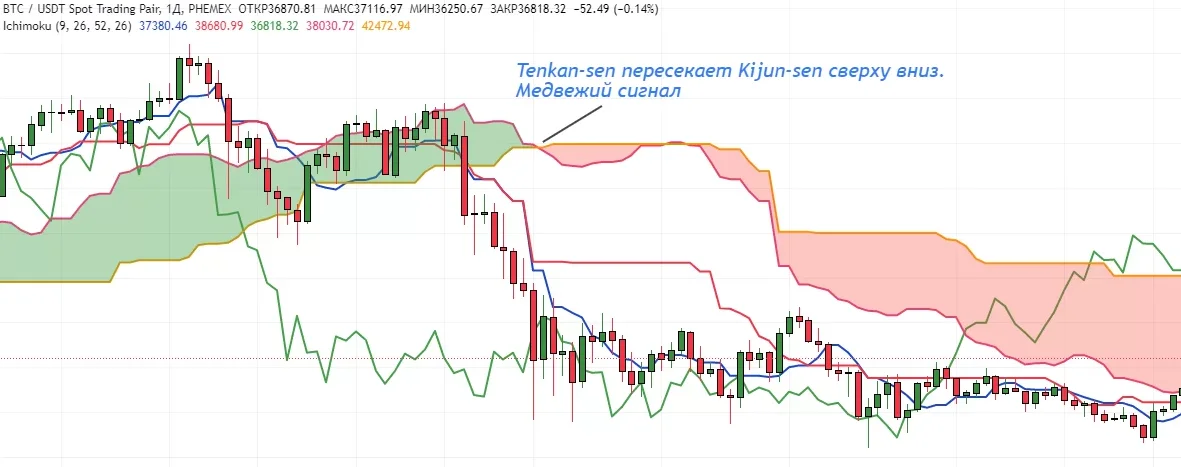
The indicator generates signals showing the direction of movement and moments to open positions on the movement of the trend.
Conclusion
Technical analysis indicators are mainly used for mid-term and long-term trading in cryptocurrencies. The signals generated by them should be perceived as additional cues for opening trading positions. In addition, other methods are used: market depth, footprint and clusters. Market depth is a table with current orders to buy and sell cryptocurrencies. Footprint is a protocol where they are displayed in volumes and prices. Cluster is the total volume of purchases and sales at a certain price over a selected time period.
Useful material?
 Telegram
  Twitter
 Basics
Why Satoshi Nakamoto’s technical manifesto for a decentralized money system matters
Oct 31, 2022
Basics
Experts evaluated the development prospects of the new ecosystem and the investment attractiveness of its token
Oct 20, 2022
Basics
How to track fluctuations correctly and create an effective income strategy
Sep 13, 2022
Basics
Review of the most profitable offers from proven trading platforms
Aug 29, 2022
Basics
The Ethereum Foundation team has published a breakdown of major misconceptions about the upcoming network upgrade
Aug 18, 2022
Basics
What benefits the exchange offers, and what else is in the near future
Aug 4, 2022
Cryptocurrency rates
-

Bitcoin
$64 850
BTC
-0.03%
-

Ethereum
$2 551.16
ETH
+3.56%
-

BNB Smart Chain
$579.4
BSC
+1.23%
-

Ripple
$1.12
XRP
+0.53%
-

TRON
$0.160134
TRX
-1.59%
-

Dogecoin
$0.074051
DOGE
-0.34%
-

Zcash
$576.46
ZEC
+4.03%
-

Stellar XLM
$0.188985
XLM
+2.44%
-

Cardano
$0.165323
ADA
+0.4%
-

Polkadot
$3.32
DOT
+5.27%