How to see the market through: overview of top analytics services
Here are the most advanced tools to help crypto investors monitor crypto market trends and earn money

28.06.2022
935
9 min
0
The need for blockchain data analytics dates back to the early days of the cryptocurrency industry. For investors, the relevance and visibility of the data serve as indispensable tools in choosing a market strategy.
The main research tool in analytics services is on-chain analysis, that is, the analysis of publicly available information from the blockchains of existing cryptocurrencies. Clearly presented data provides a vision of the market situation and helps to build strategies for investing and trading digital assets.
There are niche services that provide information on the technological characteristics of a particular network or report on upcoming digital asset offerings (ICOs and IDOs). Tables and charts are used to visualize data, which can be used to track price dynamics, market capitalization and other data on a particular cryptocurrency.
Over the years, bitcoin and other cryptocurrencies have developed many services with different sets of tools. Many services are limited in functionality and do not provide comprehensive analytics. We will take a look at the biggest players providing unique set and tools for data analysis.
Santiment
Santiment is a multifunctional platform for cryptocurrency market analysis founded in 2016. The project team includes more than 40 analysts from 12 countries. The service provides a wide set of tools, distinguishing two types of analysis: machine (Machine Effort) and human (Human Intuition).
The first one implies monitoring of blockchain data, developers' activity on GitHub, actions of large holders, as well as analysis of social networks and sentiments within the crypto community. By human data, the company means trend and price movement analytics, network audits, research as well as signals and trading strategies.
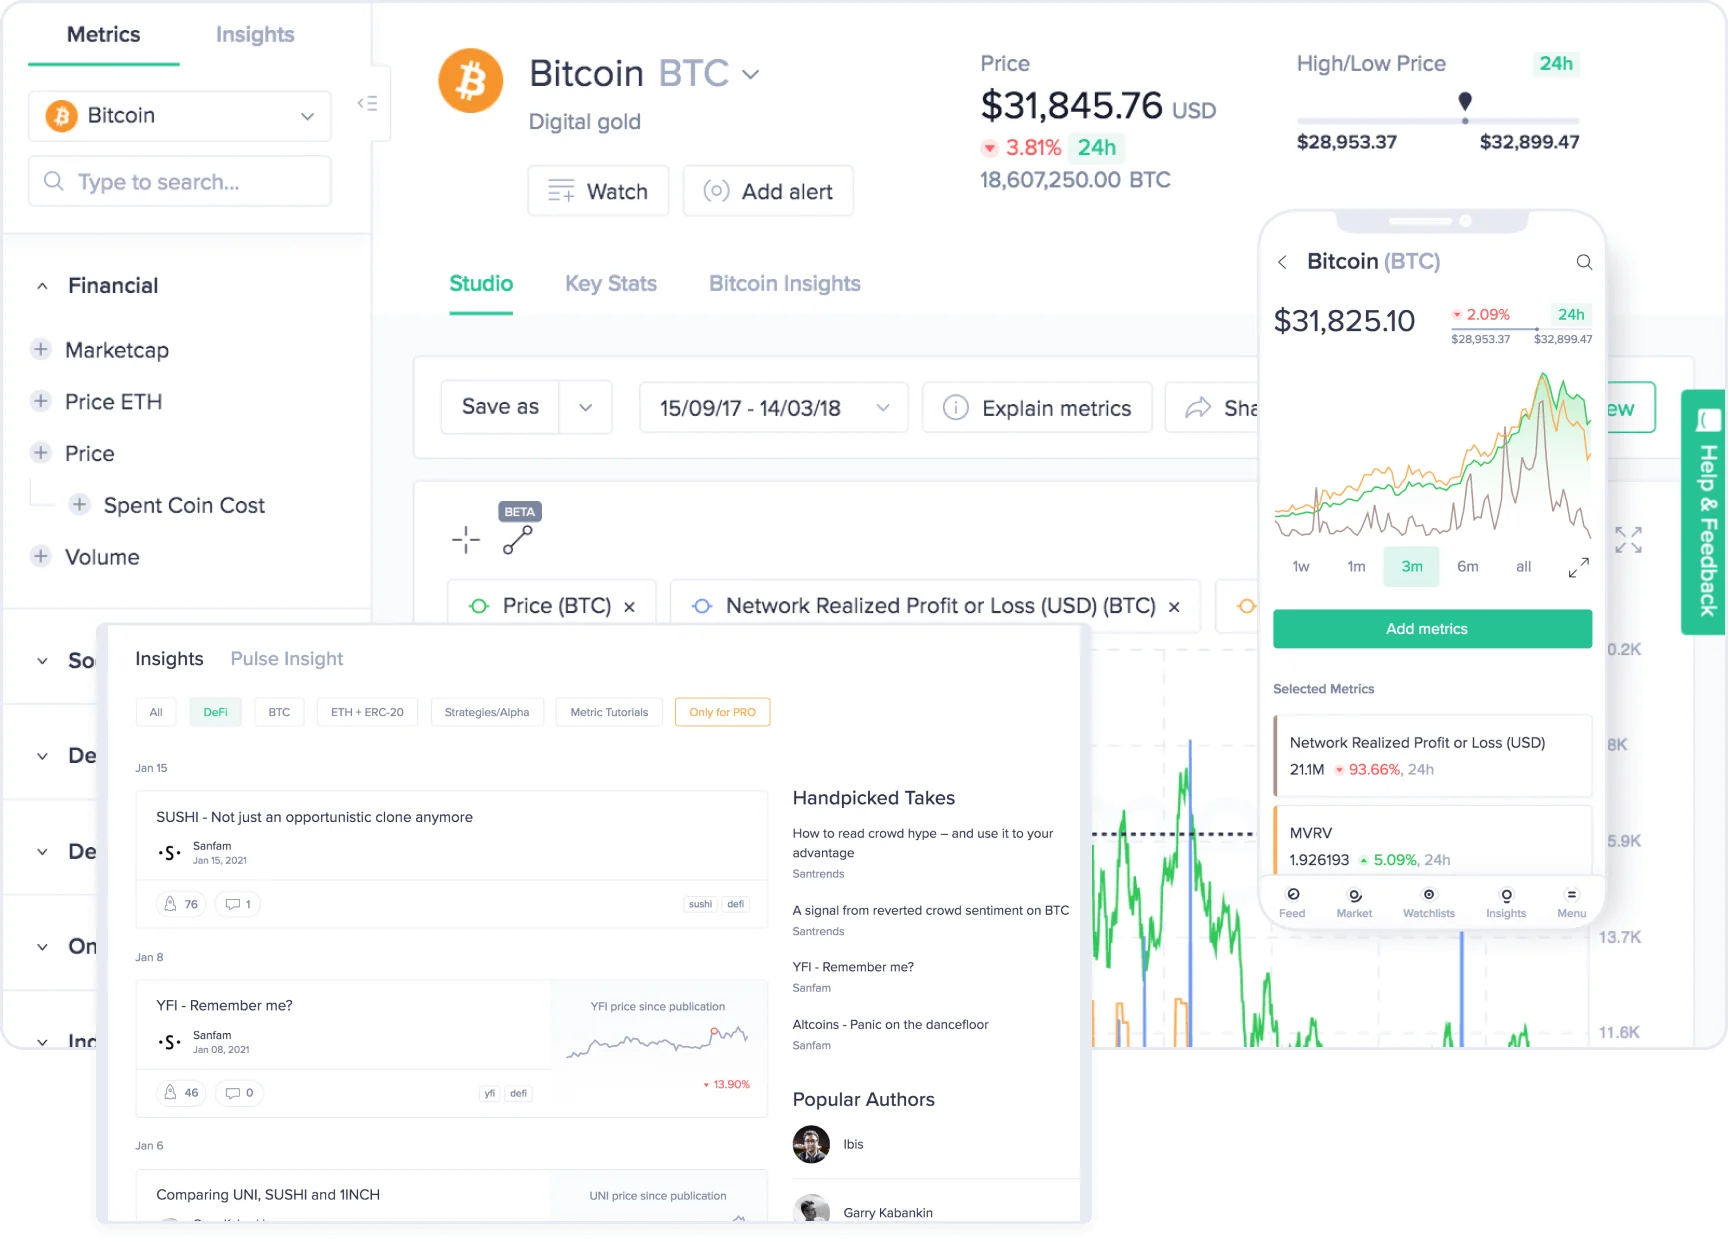
Santiment has its own market analysis interface, SanAPI. It can be used to track datasets from blockchain, depositories, social media projects and other sources. You can use the basic API functions for free, but the advanced tools become available only if you sign up for a subscription.
The platform is focused not only on private, but also on corporate users. Santiment cooperates with large cryptocurrency projects and hedge funds.
The service has its own native token under the ticker SAN. It can be used to pay for subscriptions and other payments within the platform. Staking SAN is also available to holders for free access to analytical tools and news feeds. In addition, the token can be used as a reward for users who provide additional data for analysis.
As of June 27 at 14:50 UTC, the SAN token is trading at $0,2, having gained 0,67% in a day, according to Binance.
In a study published on June 24, Santiment analysts talked about three altcoins that institutional investors were actively accumulating. According to the service's analytics, whales are showing interest in assets such as Aave (AAVE), Sandbox (SAND) and Loopring (LRC) during market declines.
Glassnode
Glassnode is a blockchain analytics company that provides market information and exchange data to crypto investors through its own web application, Glassnode Studio. The platform also publishes reviews of various areas of the crypto sphere on a separate resource, Glassnode Insights.
The service was founded in 2018 and is based in Germany; the company also has an office in Zug, Switzerland. Glassnode's main focus is on analyzing bitcoin, Ethereum and other large assets.
Glassnode Studio has hundreds of tools available for analysis, including transaction and wallet data, mining and trading volumes of cryptocurrency derivatives, as well as niche market indicators such as Spent Out Profit Ratio (SOPR), unrealized profit/loss, Puel multiple, number of coins destroyed, etc.
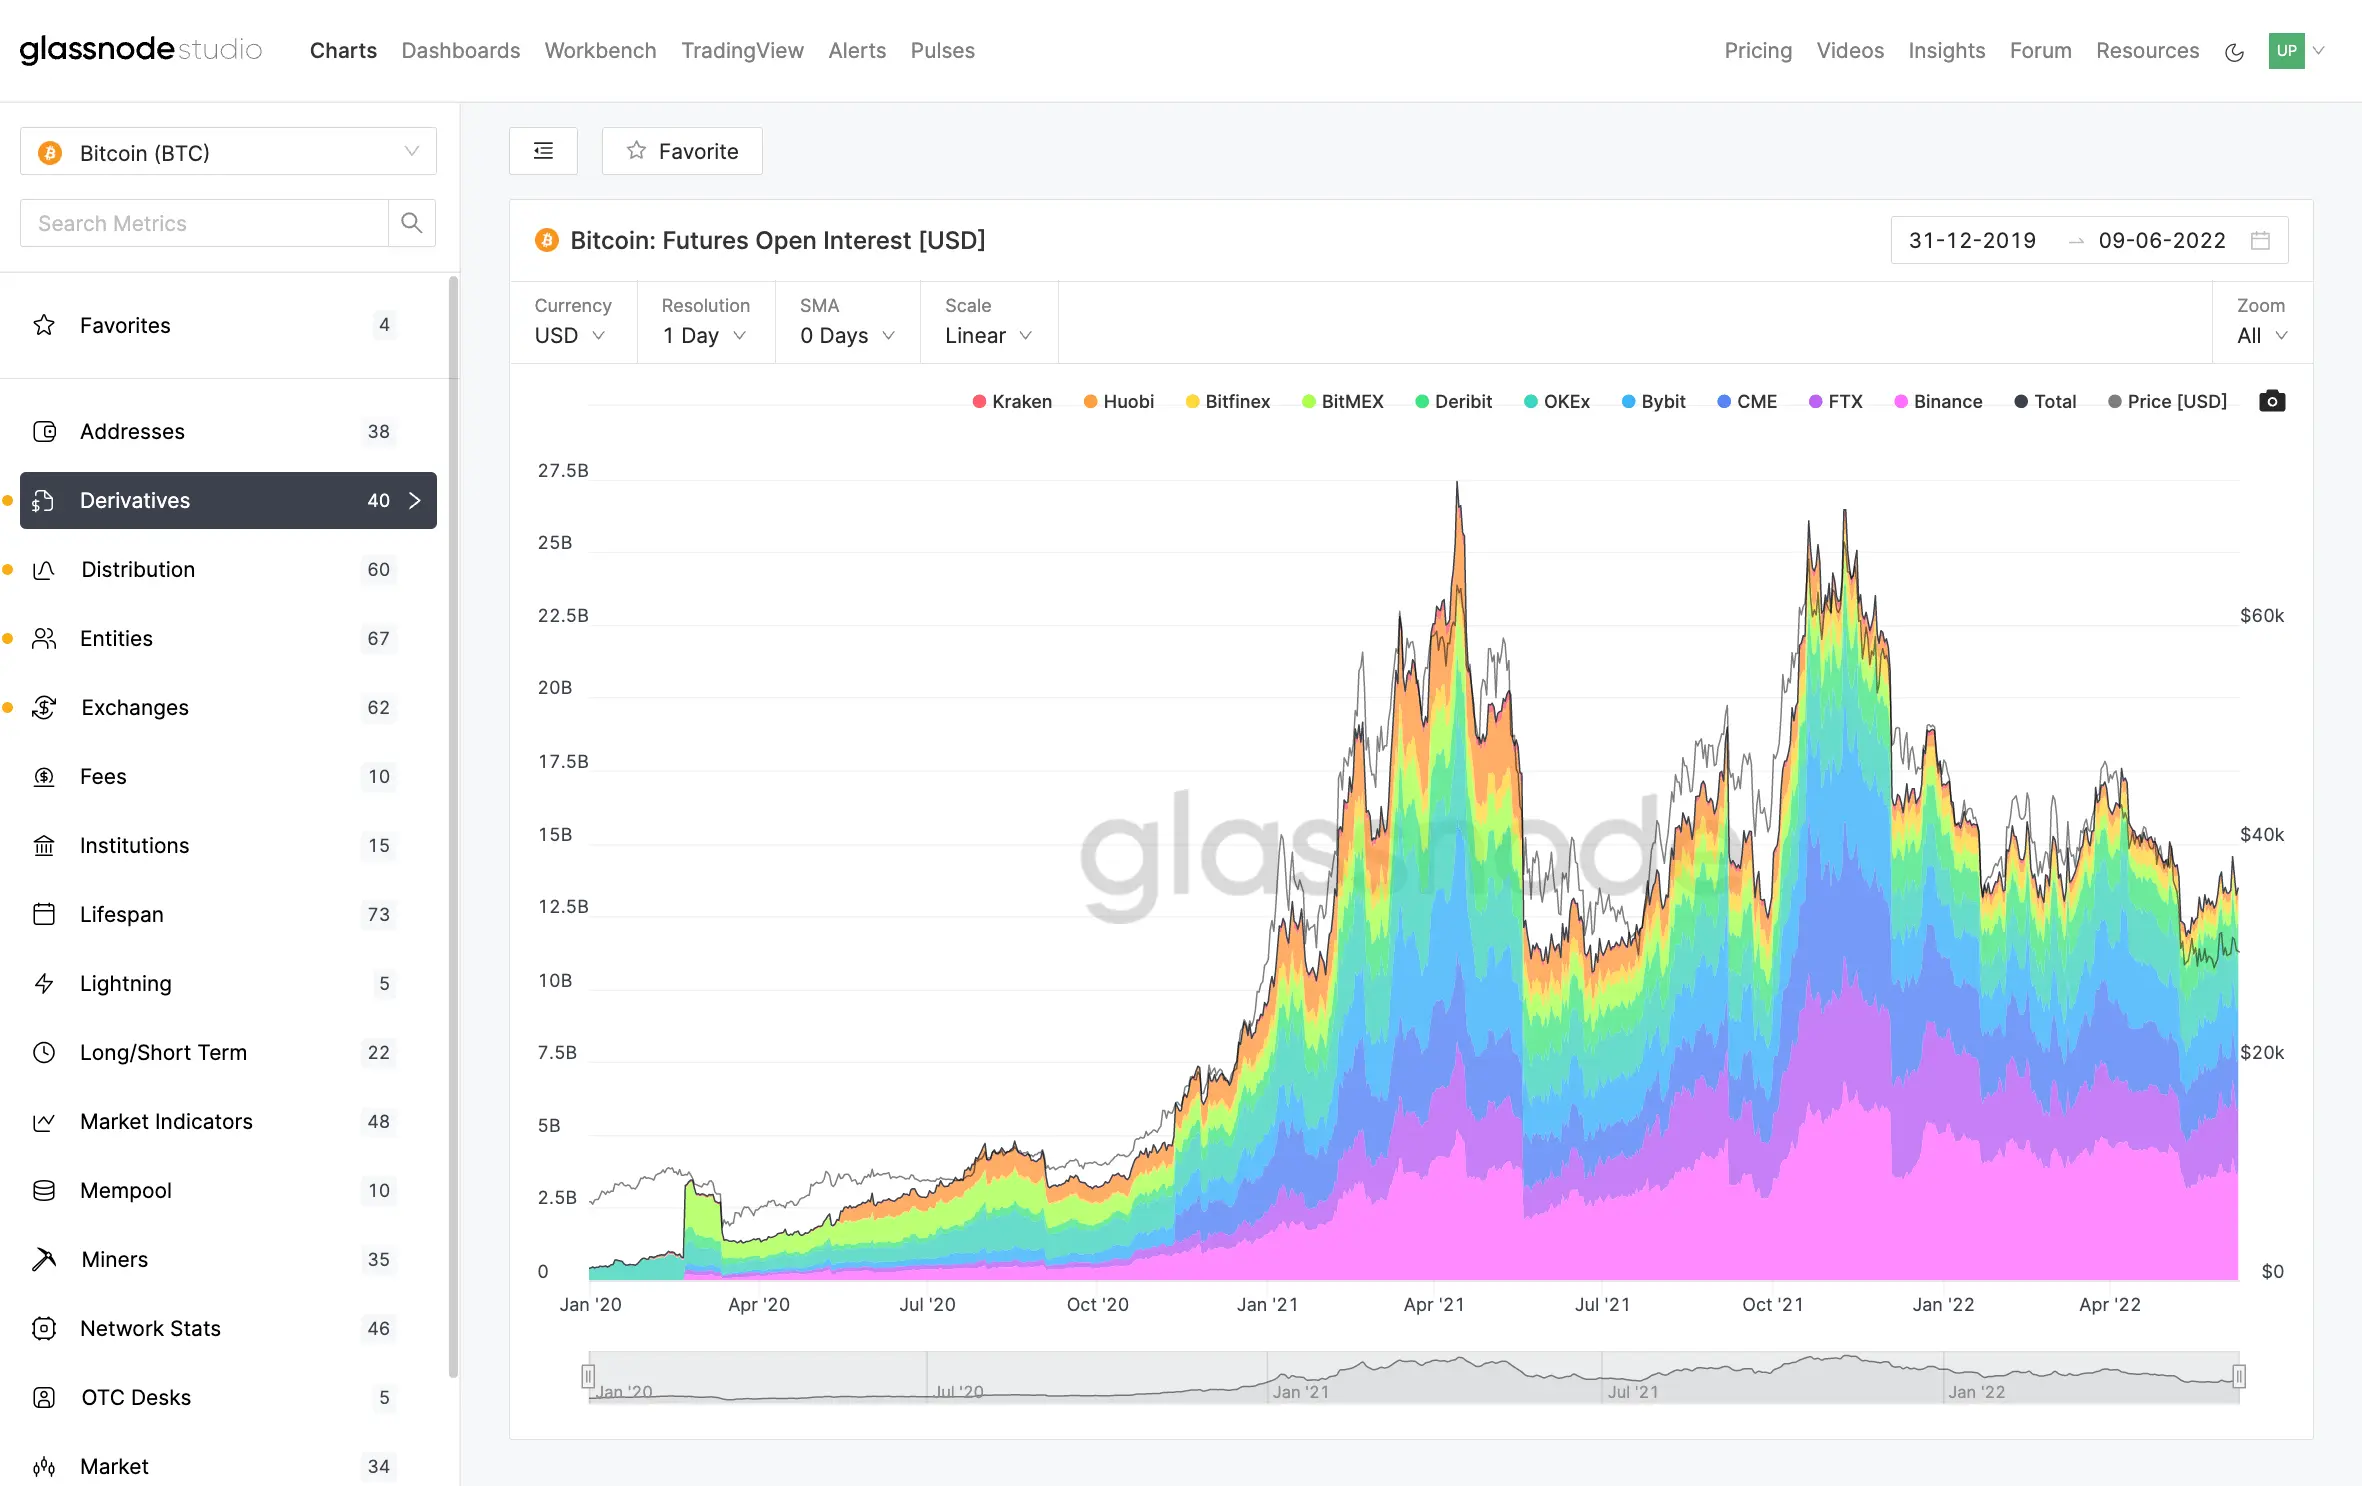
In the “Charts” section, you can select a specific asset for analysis. You can also select an analytics metric: addresses, indicators, accounts, exchanges, transactions, markets, entities, supplies, unspent transaction output (UTXO), fees, mining, blocks and coin distribution. A basic toolset is free, but most features are only available with a subscription.
On June 13, Glassnode analysts announced in a report the beginning of the “darkest” phase of the bear market. The analysts noted that a number of bitcoin's indicators pointed to its oversold conditions, but the cryptocurrency's rate still maintained its correlation with the traditional financial market and continued to decline along with it.
CryptoQuant
CryptoQuant is a community-driven analytics platform that was founded in 2015 by Gilbert Verdian, who previously worked for UK government agencies. The company's own blockchain called Quant was later launched, as well as a native token for the QNT network.
The asset is trading at $58,7, down 8,57% in a day.
The analytics service itself offers functionality similar to Glassnode. Among the available tools are market and on-chain data, as well as short-term and long-term indicators for bitcoin, Ethereum, stablecoins and ERC-20 format tokens.
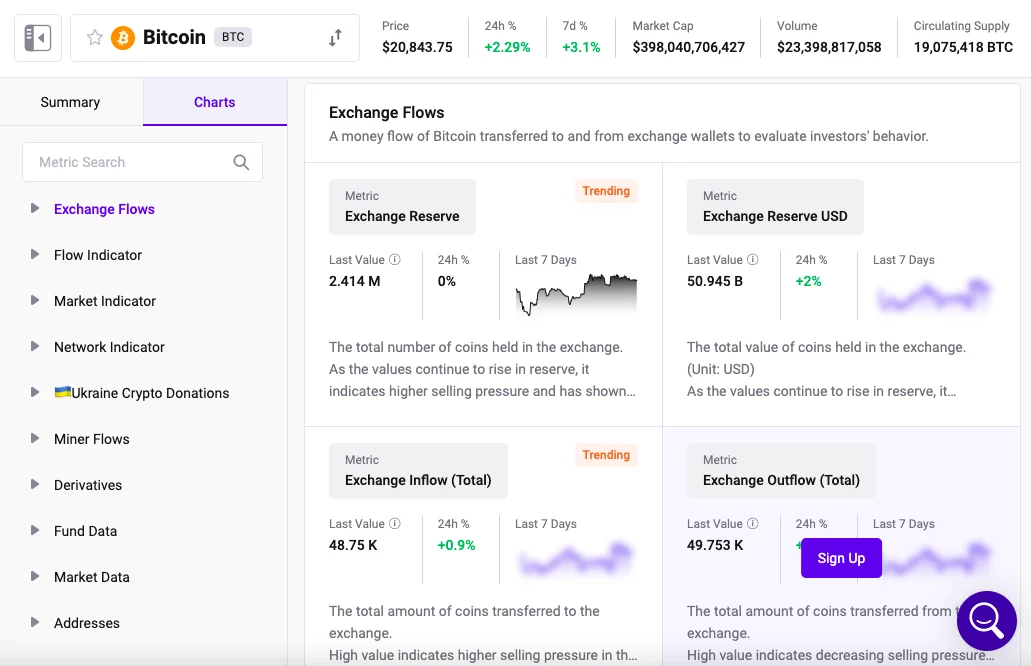
CryptoQuant distinguishes data on wallets and addresses of private users. Thanks to partnerships with cryptocurrency exchanges such as Binance, FTX and Kraken, the service can collect detailed information about the movement of assets on the platforms, for example, to track how much money has entered crypto services over a certain period of time.
One of the popular metrics on CryptoQuant is the inflow/outflow of funds from exchanges (Exchange Netflow). The inflow is determined by the amount of coins deposited into the wallets of the exchanges, while the outflow is determined by the amount of coins withdrawn. If the inflow shows high figures, it means that traders transfer money from their wallets to exchange accounts, which increases the selling pressure.
On June 14, CryptoQuant analysts recorded a record four-year inflow of bitcoins to exchanges. Traders deposited 59 376 BTC on the platforms within a day, the previous high was recorded on November 30, 2018. Analysts attribute this figure to a sharp decline in the price of the first cryptocurrency.
With the paid tool Pro Chart, you can create and publish your own charts, as well as view those created by other users. CryptoQuant also has a notification system that notifies about global events that can affect the price of a particular token.
Nansen
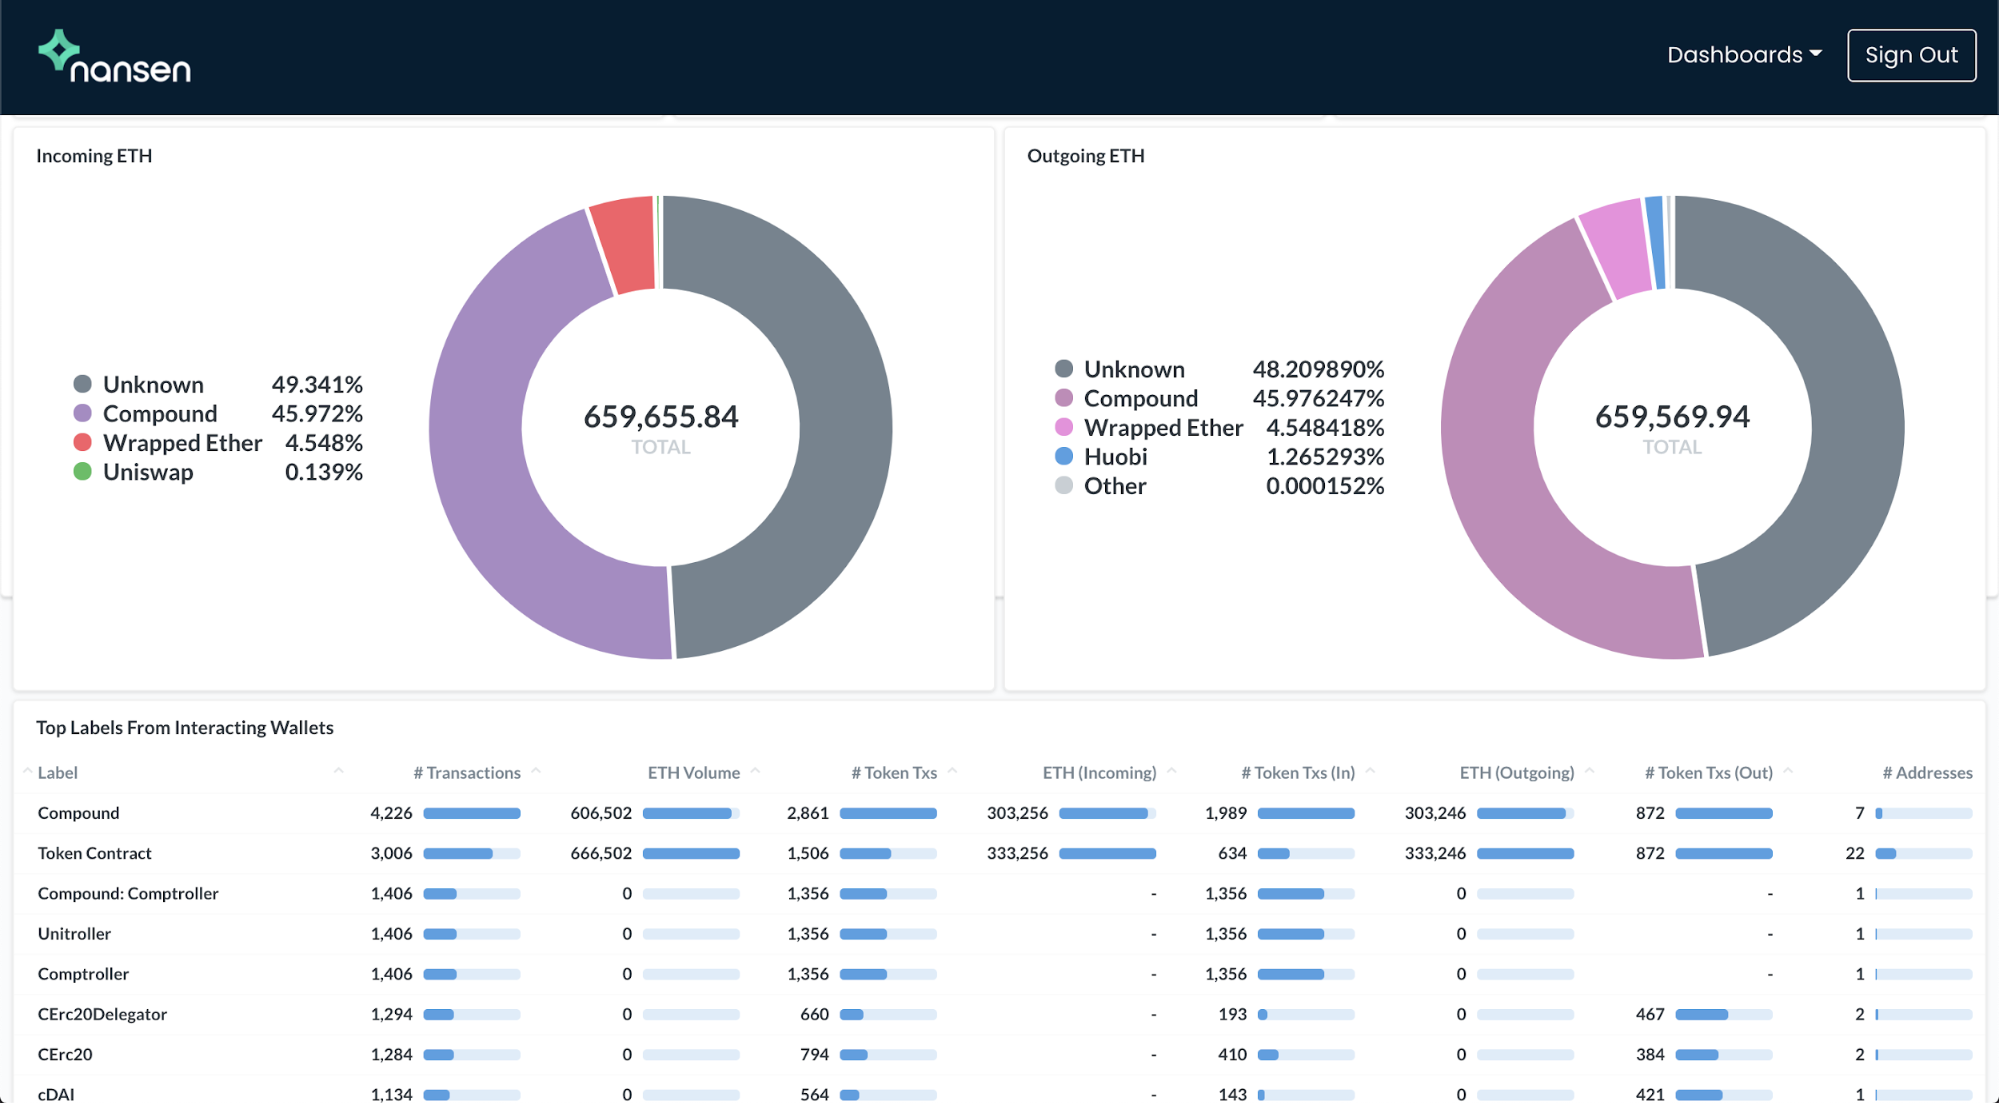
Nansen is a Singapore-based analytics company founded in 2020. The service specializes exclusively in Ethereum blockchain. The company claims that their technology makes it easy to study complex network data about investors' cash flows and exchange activity. The service helps track new trends in DeFi, NFT and decentralized autonomous organizations (DAOs) through optimized visual dashboards.
Information on the platform is obtained from a variety of sources, including smart contracts and social network analysis, machine learning and the company's own research. Most of Nansen's metrics are derived algorithmically.
In addition to standard market data, the platform provides information about NFT collections. The service has three modes of tracking non-fungible tokens:
- NFT Paradise — a general market overview that includes 24-hour activity (trading volume, minimum prices, buying activity) and monitoring trending projects.
- NFT God Mode — the tool visualizes data related to collections (for example, price, volume, transaction overview), holder activity, wallet analysis and individual NFT profiler.
- NFT Indexes — token index data.
Nansen also has a “wash trade” filter that scans individual transactions and identifies suspicious activity, removing transactions that fall under suspicion from the results of the output. Like CryptoQuant, the platform has a smart notification system that reports significant events in the crypto sphere.
In late May, Nansen conducted an investigation that revealed that the Celsius Network's DeFi-lending platform was involved in the collapse of the Terra ecosystem (LUNA). According to experts, two addresses “significantly impacted the UST de-peg,” and one of them was linked to Celsius. About 420 million UST were withdrawn from the two wallets from Anchor's lending protocol in 15 transactions.
Elliptic
Elliptic is a London-based company founded in 2013 that analyzes blockchain networks. The platform provides financial companies and exchanges with detailed data on the cryptocurrency market, and collaborates with law enforcement agencies to combat money laundering. The platform works with most well-known blockchains, including Bitcoin Cash and Ripple.
Elliptic can tag and link addresses and individual transactions with each other using its technologies. The service enables KYC (Know Your Customer) verification of cryptocurrency users or tracking illegal transactions. Some of the leading venture capital funds have partnered with Elliptic: SBI Group, Albion VC, Octopus Ventures, SignalFire, Paladin Capital, Santander InnoVentures and Digital Currency Group.
The platform analyzes wallets belonging to illegal darknet resources. In 2021, analysts were able to detect the movement of funds associated with the Silk Road Marketplace, which closed in 2014. In a May 2022 report, Elliptic experts reported that Dogecoin (DOGE) cryptocurrency was being used in illegal activities. According to the analysts, the meme-cryptocurrency was most often used in fraudulent schemes and Ponzi schemes, but also in the purchase of banned content and substances, as well as for terrorism financing.
Useful material?
 Telegram
  Twitter
 Research
One and the same cryptocurrency address received two completely opposite assessments from different analytics systems: from an ordinary gambling service to an extremely severe criminal offense. This story has become the starting point for a broader conversation about what the scientific standards of blockchain analysis should look like — and why errors in systems like these can shape the fates of real people.
Jul 1, 2026
Research
The blockchain has helped uncover the ties between cryptocurrency fundraising campaigns, exchangers in Syria, and intermediaries in several countries around the world. A telltale pattern has emerged in which the same addresses were used across multiple donation drives at once
Jun 24, 2026
Research
Four Iranian cryptocurrency exchanges accounted for roughly 78% of all digital asset volume tied to the country in 2025. They have now become the focal point of the largest U.S. sanctions campaign against Iran's cryptocurrency infrastructure.
Jun 5, 2026
Research
A financial system is already up and running on public blockchains, with loans, analogues of U.S. Treasuries, and automated capital markets. More than $551 billion has flowed through DeFi protocols — but most of that activity has nothing to do with the real economy and everything to do with the speculative build-up of risk.
May 29, 2026
Research
Around 97% of Chinese suppliers of chemicals used to make fentanyl accept payment in cryptocurrency. The volume of such transactions continues to grow alongside the global market for synthetic drugs
May 22, 2026
Research
For the first time, the new law makes blockchain analytics an officially mandatory tool of financial oversight in the United States. Authorities will also gain the power to restrict transactions with foreign crypto services tied to money-laundering risks.
May 20, 2026
Cryptocurrency rates
-

Bitcoin
$65 118
BTC
-1.33%
-

Ethereum
$2 551.16
ETH
+3.56%
-

BNB Smart Chain
$579.4
BSC
+1.23%
-

Ripple
$1.11
XRP
-2.66%
-

TRON
$0.160134
TRX
-1.59%
-

Dogecoin
$0.069534
DOGE
-4.64%
-

Zcash
$501.34
ZEC
-2.16%
-

Cardano
$0.168425
ADA
-3.92%
-

Stellar XLM
$0.182361
XLM
-3.11%
-

Polkadot
$3.32
DOT
+5.27%